Published by Dimitris Kougioumtzis · Updated
Choose integer pixel coordinates using an incrementally updated decision error; no floating-point calculation is required.
Start at one endpoint, maintain a signed decision error, and increment the horizontal and/or vertical pixel coordinate according to twice that error until the target endpoint is plotted.
When to use Bresenham line rasterization
Rasterizing a straight line on an integer pixel grid without floating-point division.
Choosing an alternative
Direct parametric sampling rounds independent positions. Bresenham updates one compact error state and supports shallow, steep, negative and reversed directions.
Worked example: input and state changes
Example input
-6,-3,7,5These checkpoints follow the actual example timeline. State details show the stored values and decisions; use the visualization to inspect every intervening step.
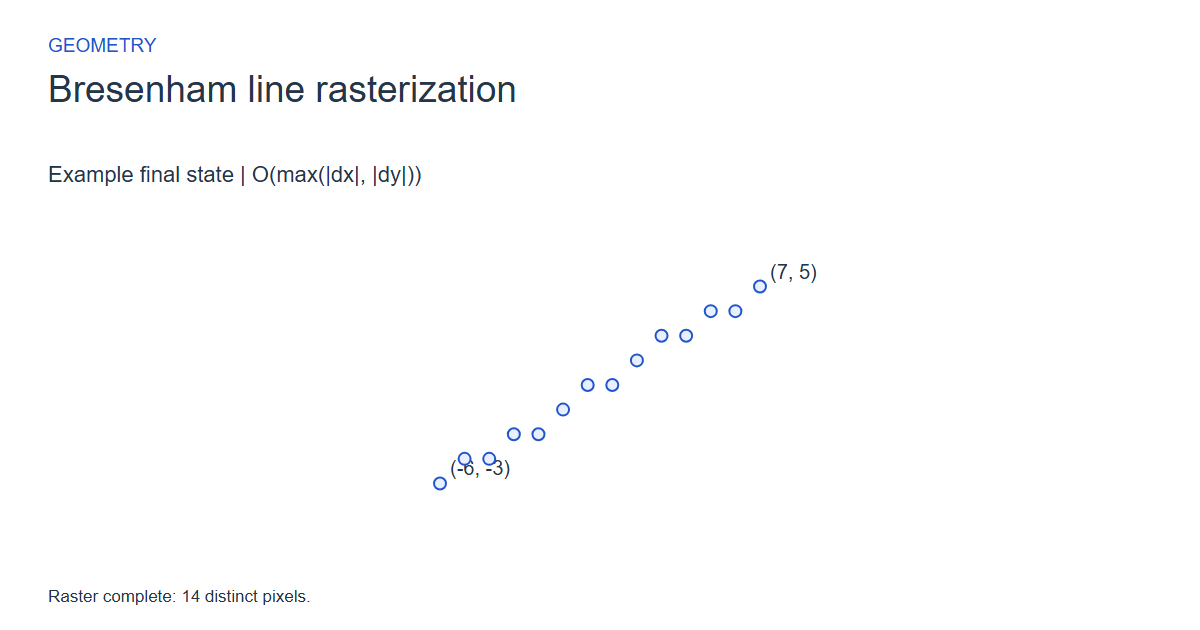
Step 0: Integer pixel centers on equal-scale axes; faint points are not processed yet.
State at this checkpoint
{
  "values": [
    0,
    1,
    2,
    3,
    4,
    5,
    6,
    7,
    8,
    9,
    10,
    11,
    12,
    13
  ],
  "active": [],
  "kind": "graph",
  "points": [
    [
      -6,
      -3
    ],
    [
      -5,
      -2
    ],
    [
      -4,
      -2
    ],
    [
      -3,
      -1
    ],
    [
      -2,
      -1
    ],
    [
      -1,
      0
    ],
    [
      0,
      1
    ],
    [
      1,
      1
    ],
    [
      2,
      2
    ],
    [
      3,
      3
    ],
    [
      4,
      3
    ],
    [
      5,
      4
    ],
    [
      6,
      4
    ],
    [
      7,
      5
    ]
  ],
  "nodeLabels": [
    "(-6, -3)",
    "(-5, -2)",
    "(-4, -2)",
    "(-3, -1)",
    "(-2, -1)",
    "(-1, 0)",
    "(0, 1)",
    "(1, 1)",
    "(2, 2)",
    "(3, 3)",
    "(4, 3)",
    "(5, 4)",
    "(6, 4)",
    "(7, 5)"
  ],
  "pointLabelIndices": [
    0,
    13
  ],
  "directed": false,
  "chosen": [],
  "visited": [],
  "result": 0,
  "output": []
}
Step 4: Plot (-3, -1); error 7.
State at this checkpoint
{
  "values": [
    0,
    1,
    2,
    3,
    4,
    5,
    6,
    7,
    8,
    9,
    10,
    11,
    12,
    13
  ],
  "active": [
    3
  ],
  "kind": "graph",
  "points": [
    [
      -6,
      -3
    ],
    [
      -5,
      -2
    ],
    [
      -4,
      -2
    ],
    [
      -3,
      -1
    ],
    [
      -2,
      -1
    ],
    [
      -1,
      0
    ],
    [
      0,
      1
    ],
    [
      1,
      1
    ],
    [
      2,
      2
    ],
    [
      3,
      3
    ],
    [
      4,
      3
    ],
    [
      5,
      4
    ],
    [
      6,
      4
    ],
    [
      7,
      5
    ]
  ],
  "nodeLabels": [
    "(-6, -3)",
    "(-5, -2)",
    "(-4, -2)",
    "(-3, -1)",
    "(-2, -1)",
    "(-1, 0)",
    "(0, 1)",
    "(1, 1)",
    "(2, 2)",
    "(3, 3)",
    "(4, 3)",
    "(5, 4)",
    "(6, 4)",
    "(7, 5)"
  ],
  "pointLabelIndices": [
    0,
    13
  ],
  "directed": false,
  "chosen": [],
  "visited": [
    0,
    1,
    2,
    3
  ],
  "result": 4,
  "output": []
}
Step 8: Plot (1, 1); error 1.
State at this checkpoint
{
  "values": [
    0,
    1,
    2,
    3,
    4,
    5,
    6,
    7,
    8,
    9,
    10,
    11,
    12,
    13
  ],
  "active": [
    7
  ],
  "kind": "graph",
  "points": [
    [
      -6,
      -3
    ],
    [
      -5,
      -2
    ],
    [
      -4,
      -2
    ],
    [
      -3,
      -1
    ],
    [
      -2,
      -1
    ],
    [
      -1,
      0
    ],
    [
      0,
      1
    ],
    [
      1,
      1
    ],
    [
      2,
      2
    ],
    [
      3,
      3
    ],
    [
      4,
      3
    ],
    [
      5,
      4
    ],
    [
      6,
      4
    ],
    [
      7,
      5
    ]
  ],
  "nodeLabels": [
    "(-6, -3)",
    "(-5, -2)",
    "(-4, -2)",
    "(-3, -1)",
    "(-2, -1)",
    "(-1, 0)",
    "(0, 1)",
    "(1, 1)",
    "(2, 2)",
    "(3, 3)",
    "(4, 3)",
    "(5, 4)",
    "(6, 4)",
    "(7, 5)"
  ],
  "pointLabelIndices": [
    0,
    13
  ],
  "directed": false,
  "chosen": [],
  "visited": [
    0,
    1,
    2,
    3,
    4,
    5,
    6,
    7
  ],
  "result": 8,
  "output": []
}
Step 11: Plot (4, 3); error 3.
State at this checkpoint
{
  "values": [
    0,
    1,
    2,
    3,
    4,
    5,
    6,
    7,
    8,
    9,
    10,
    11,
    12,
    13
  ],
  "active": [
    10
  ],
  "kind": "graph",
  "points": [
    [
      -6,
      -3
    ],
    [
      -5,
      -2
    ],
    [
      -4,
      -2
    ],
    [
      -3,
      -1
    ],
    [
      -2,
      -1
    ],
    [
      -1,
      0
    ],
    [
      0,
      1
    ],
    [
      1,
      1
    ],
    [
      2,
      2
    ],
    [
      3,
      3
    ],
    [
      4,
      3
    ],
    [
      5,
      4
    ],
    [
      6,
      4
    ],
    [
      7,
      5
    ]
  ],
  "nodeLabels": [
    "(-6, -3)",
    "(-5, -2)",
    "(-4, -2)",
    "(-3, -1)",
    "(-2, -1)",
    "(-1, 0)",
    "(0, 1)",
    "(1, 1)",
    "(2, 2)",
    "(3, 3)",
    "(4, 3)",
    "(5, 4)",
    "(6, 4)",
    "(7, 5)"
  ],
  "pointLabelIndices": [
    0,
    13
  ],
  "directed": false,
  "chosen": [],
  "visited": [
    0,
    1,
    2,
    3,
    4,
    5,
    6,
    7,
    8,
    9,
    10
  ],
  "result": 11,
  "output": []
}
Step 15: Raster complete: 14 distinct pixels.
State at this checkpoint
{
  "values": [
    0,
    1,
    2,
    3,
    4,
    5,
    6,
    7,
    8,
    9,
    10,
    11,
    12,
    13
  ],
  "active": [],
  "kind": "graph",
  "points": [
    [
      -6,
      -3
    ],
    [
      -5,
      -2
    ],
    [
      -4,
      -2
    ],
    [
      -3,
      -1
    ],
    [
      -2,
      -1
    ],
    [
      -1,
      0
    ],
    [
      0,
      1
    ],
    [
      1,
      1
    ],
    [
      2,
      2
    ],
    [
      3,
      3
    ],
    [
      4,
      3
    ],
    [
      5,
      4
    ],
    [
      6,
      4
    ],
    [
      7,
      5
    ]
  ],
  "nodeLabels": [
    "(-6, -3)",
    "(-5, -2)",
    "(-4, -2)",
    "(-3, -1)",
    "(-2, -1)",
    "(-1, 0)",
    "(0, 1)",
    "(1, 1)",
    "(2, 2)",
    "(3, 3)",
    "(4, 3)",
    "(5, 4)",
    "(6, 4)",
    "(7, 5)"
  ],
  "pointLabelIndices": [
    0,
    13
  ],
  "directed": false,
  "chosen": [],
  "visited": [
    0,
    1,
    2,
    3,
    4,
    5,
    6,
    7,
    8,
    9,
    10,
    11,
    12,
    13
  ],
  "result": 14,
  "output": [
    -6,
    -3,
    -5,
    -2,
    -4,
    -2,
    -3,
    -1,
    -2,
    -1,
    -1,
    0,
    0,
    1,
    1,
    1,
    2,
    2,
    3,
    3,
    4,
    3,
    5,
    4,
    6,
    4,
    7,
    5
  ]
}
Expected final state
Raster complete: 14 distinct pixels.
Complexity and input bounds
Family: Geometry. Time complexity: O(max(|dx|, |dy|)).
Implementation detail: Endpoint coordinates -12..12. Return the pixel count and write interleaved x,y output, at most fifty integers. All octants and reverse endpoint cases are compared with independent direct rounding in every language. The view keeps all pixel centers at a fixed equal-scale position across playback.
Space complexity: O(1) working state excluding the output pixels and recorded frames.
Working-space bounds describe algorithm state and any explicitly noted output, excluding the visualization's saved timeline. Recording frames can use more memory than running the function alone. Here n is sequence length, V and E are vertex and edge counts, and other parameters refer to the named input dimensions.
x0,y0,x1,y1 integers -12..12. Include both endpoints; exact half ties step toward the target.
The playground validates these limits before starting. Downloaded functions are callable implementations, with parameter and output-buffer contracts in their comments; they do not all repeat the playground's input validation.
Common mistakes and limitations
Use the same saved twice-error value for both axis decisions. Include both endpoints and handle a zero-length line. Half-step ties are target-directed; reversing the endpoints can change which equally close pixels are chosen.
Further reading
For background on algorithm analysis and the JavaScript function interface:
- MIT OpenCourseWare: algorithm design and analysis foundations
- MDN: JavaScript function parameters and return values
Editorial and testing approach · Browse all algorithm guides
Complete JavaScript implementation
1 2 3 4 5 6 | // All-octant integer Bresenham line. Endpoints -12..12. Return pixel count and write interleaved x,y pairs including both endpoints (capacity at least 2*(max(abs(dx),abs(dy))+1), at most 50 integers). Half-step ties move toward the target, so reverse traversal need not reverse the exact same pixel set. Zero-length line emits one pixel. O(max(abs(dx),abs(dy))) time, O(1) working state. Reference snippets assume validated playground inputs. Fixed scratch buffers have 256 slots. Sorting variants may use a different traversal strategy than the animation. function algorithm(x0, y0, x1, y1, output) { let dx = x1-x0; if (dx < 0) { dx = -dx; } let dy = y1-y0; if (dy > 0) { dy = -dy; } let sx = -1; let sy = -1; if (x0 < x1) { sx = 1; } if (y0 < y1) { sy = 1; } let error = dx+dy; let twice = 0; let count = 0; let done = 0; while (done == 0) { output[2*count] = x0; output[2*count+1] = y0; count++; if (x0 == x1 && y0 == y1) { done = 1; } else { twice = 2*error; if (twice >= dy) { error += dy; x0 += sx; } if (twice <= dx) { error += dx; y0 += sy; } } } return count; } |
Source
Original incremental line plotting research. The playground uses a compact symmetric all-octant formulation with an explicit target-directed half-step tie convention, rather than reproducing the original plotter program.
- Algorithm for computer control of a digital plotter
J. E. Bresenham (1965). Research paper.