Published by Dimitris Kougioumtzis · Updated
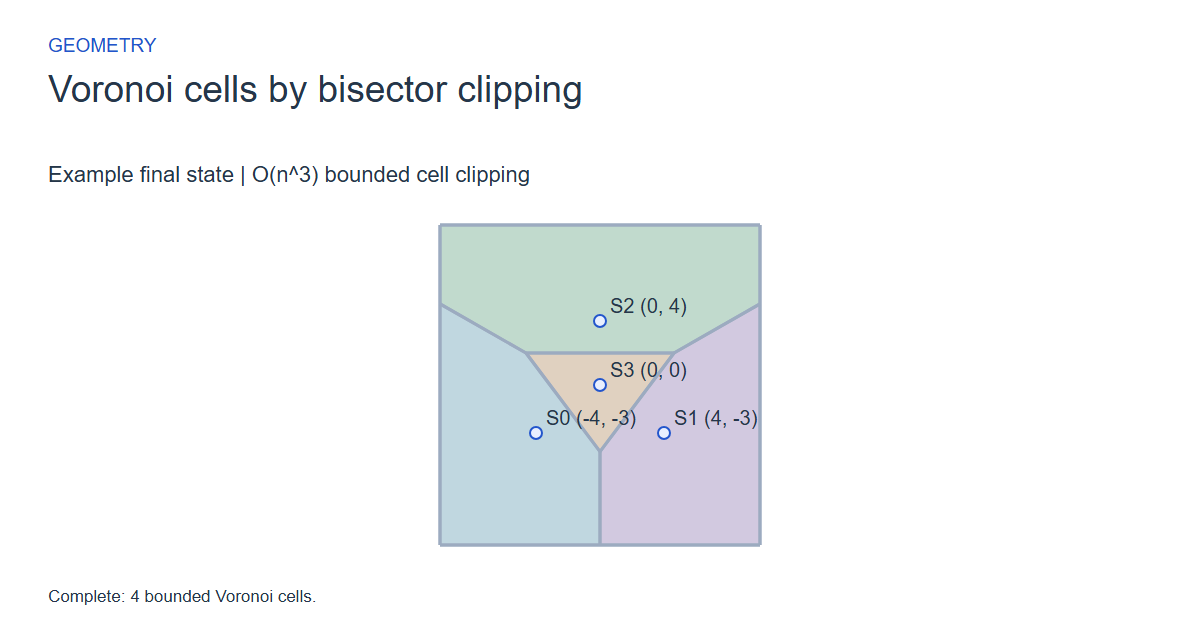
Clip a fixed bounding box by each competing site’s nearest-point half-plane to construct bounded Euclidean Voronoi cells.
Begin each site cell as the fixed bounding box. For every competing site, clip that cell by the perpendicular-bisector half-plane whose points are no farther from the current site. Canonicalize and retain the resulting convex cell.
When to use Voronoi cells by bisector clipping
Exploring bounded nearest-site regions and their relationship to a Delaunay mesh.
Choosing an alternative
Fortune?s method uses a sweep-line structure; this bounded view clips cells independently and prioritizes a visible geometric construction. Clipping the display box turns unbounded exterior regions into finite polygons.
Worked example: input and state changes
Example input
-4,-3;4,-3;0,4;0,0These checkpoints follow the actual example timeline. State details show the stored values and decisions; use the visualization to inspect every intervening step.
Step 0: Bounded Euclidean Voronoi diagram; duplicate sites use their first index.
State at this checkpoint
{
  "values": [
    0,
    1,
    2,
    3,
    4,
    5,
    6,
    7
  ],
  "active": [],
  "kind": "graph",
  "points": [
    [
      -10,
      -10
    ],
    [
      10,
      -10
    ],
    [
      10,
      10
    ],
    [
      -10,
      10
    ],
    [
      -4,
      -3
    ],
    [
      4,
      -3
    ],
    [
      0,
      4
    ],
    [
      0,
      0
    ]
  ],
  "nodeLabels": [
    "",
    "",
    "",
    "",
    "S0 (-4, -3)",
    "S1 (4, -3)",
    "S2 (0, 4)",
    "S3 (0, 0)"
  ],
  "pointMarkerIndices": [
    4,
    5,
    6,
    7
  ],
  "pointLabelIndices": [
    4,
    5,
    6,
    7
  ],
  "polygons": [],
  "directed": false,
  "chosen": [],
  "visited": [],
  "result": 0,
  "output": []
}
Step 4: Complete bounded cell S0.
State at this checkpoint
{
  "values": [
    0,
    1,
    2,
    3,
    4,
    5,
    6,
    7,
    8,
    9,
    10,
    11,
    12
  ],
  "active": [],
  "kind": "graph",
  "points": [
    [
      -10,
      -10
    ],
    [
      10,
      -10
    ],
    [
      10,
      10
    ],
    [
      -10,
      10
    ],
    [
      -4,
      -3
    ],
    [
      4,
      -3
    ],
    [
      0,
      4
    ],
    [
      0,
      0
    ],
    [
      -10,
      -10
    ],
    [
      0,
      -10
    ],
    [
      0,
      -4.166666666666667
    ],
    [
      -4.625,
      2
    ],
    [
      -10,
      5.071428571428571
    ]
  ],
  "nodeLabels": [
    "",
    "",
    "",
    "",
    "S0 (-4, -3)",
    "S1 (4, -3)",
    "S2 (0, 4)",
    "S3 (0, 0)",
    "",
    "",
    "",
    "",
    ""
  ],
  "pointMarkerIndices": [
    4,
    5,
    6,
    7
  ],
  "pointLabelIndices": [
    4,
    5,
    6,
    7
  ],
  "polygons": [
    {
      "indices": [
        8,
        9,
        10,
        11,
        12
      ],
      "color": [
        0.18,
        0.48,
        0.6
      ]
    }
  ],
  "directed": false,
  "chosen": [],
  "visited": [],
  "result": 0,
  "output": []
}
Step 9: Cell S2: keep points at least as near to S2 as S0.
State at this checkpoint
{
  "values": [
    0,
    1,
    2,
    3,
    4,
    5,
    6,
    7,
    8,
    9,
    10,
    11,
    12,
    13,
    14,
    15,
    16,
    17,
    18,
    19,
    20,
    21
  ],
  "active": [
    6
  ],
  "kind": "graph",
  "points": [
    [
      -10,
      -10
    ],
    [
      10,
      -10
    ],
    [
      10,
      10
    ],
    [
      -10,
      10
    ],
    [
      -4,
      -3
    ],
    [
      4,
      -3
    ],
    [
      0,
      4
    ],
    [
      0,
      0
    ],
    [
      -10,
      -10
    ],
    [
      0,
      -10
    ],
    [
      0,
      -4.166666666666667
    ],
    [
      -4.625,
      2
    ],
    [
      -10,
      5.071428571428571
    ],
    [
      0,
      -10
    ],
    [
      10,
      -10
    ],
    [
      10,
      5.071428571428571
    ],
    [
      4.625,
      2.0000000000000004
    ],
    [
      0,
      -4.166666666666666
    ],
    [
      -10,
      5.071428571428571
    ],
    [
      10,
      -6.357142857142858
    ],
    [
      10,
      10
    ],
    [
      -10,
      10
    ]
  ],
  "nodeLabels": [
    "",
    "",
    "",
    "",
    "S0 (-4, -3)",
    "S1 (4, -3)",
    "S2 (0, 4)",
    "S3 (0, 0)",
    "",
    "",
    "",
    "",
    "",
    "",
    "",
    "",
    "",
    "",
    "",
    "",
    "",
    ""
  ],
  "pointMarkerIndices": [
    4,
    5,
    6,
    7
  ],
  "pointLabelIndices": [
    4,
    5,
    6,
    7
  ],
  "polygons": [
    {
      "indices": [
        8,
        9,
        10,
        11,
        12
      ],
      "color": [
        0.18,
        0.48,
        0.6
      ]
    },
    {
      "indices": [
        13,
        14,
        15,
        16,
        17
      ],
      "color": [
        0.42,
        0.3,
        0.6
      ]
    },
    {
      "indices": [
        18,
        19,
        20,
        21
      ],
      "color": [
        0.2,
        0.52,
        0.35
      ]
    }
  ],
  "directed": false,
  "chosen": [
    14,
    15,
    16,
    17
  ],
  "visited": [],
  "result": 0,
  "output": []
}
Step 13: Cell S3: keep points at least as near to S3 as S0.
State at this checkpoint
{
  "values": [
    0,
    1,
    2,
    3,
    4,
    5,
    6,
    7,
    8,
    9,
    10,
    11,
    12,
    13,
    14,
    15,
    16,
    17,
    18,
    19,
    20,
    21,
    22,
    23,
    24,
    25,
    26,
    27,
    28
  ],
  "active": [
    7
  ],
  "kind": "graph",
  "points": [
    [
      -10,
      -10
    ],
    [
      10,
      -10
    ],
    [
      10,
      10
    ],
    [
      -10,
      10
    ],
    [
      -4,
      -3
    ],
    [
      4,
      -3
    ],
    [
      0,
      4
    ],
    [
      0,
      0
    ],
    [
      -10,
      -10
    ],
    [
      0,
      -10
    ],
    [
      0,
      -4.166666666666667
    ],
    [
      -4.625,
      2
    ],
    [
      -10,
      5.071428571428571
    ],
    [
      0,
      -10
    ],
    [
      10,
      -10
    ],
    [
      10,
      5.071428571428571
    ],
    [
      4.625,
      2.0000000000000004
    ],
    [
      0,
      -4.166666666666666
    ],
    [
      -10,
      5.071428571428571
    ],
    [
      -4.625,
      2
    ],
    [
      4.625000000000001,
      2
    ],
    [
      10,
      5.071428571428571
    ],
    [
      10,
      10
    ],
    [
      -10,
      10
    ],
    [
      -10,
      9.166666666666666
    ],
    [
      4.375,
      -10
    ],
    [
      10,
      -10
    ],
    [
      10,
      10
    ],
    [
      -10,
      10
    ]
  ],
  "nodeLabels": [
    "",
    "",
    "",
    "",
    "S0 (-4, -3)",
    "S1 (4, -3)",
    "S2 (0, 4)",
    "S3 (0, 0)",
    "",
    "",
    "",
    "",
    "",
    "",
    "",
    "",
    "",
    "",
    "",
    "",
    "",
    "",
    "",
    "",
    "",
    "",
    "",
    "",
    ""
  ],
  "pointMarkerIndices": [
    4,
    5,
    6,
    7
  ],
  "pointLabelIndices": [
    4,
    5,
    6,
    7
  ],
  "polygons": [
    {
      "indices": [
        8,
        9,
        10,
        11,
        12
      ],
      "color": [
        0.18,
        0.48,
        0.6
      ]
    },
    {
      "indices": [
        13,
        14,
        15,
        16,
        17
      ],
      "color": [
        0.42,
        0.3,
        0.6
      ]
    },
    {
      "indices": [
        18,
        19,
        20,
        21,
        22,
        23
      ],
      "color": [
        0.2,
        0.52,
        0.35
      ]
    },
    {
      "indices": [
        24,
        25,
        26,
        27,
        28
      ],
      "color": [
        0.6,
        0.4,
        0.18
      ]
    }
  ],
  "directed": false,
  "chosen": [
    20,
    21,
    22,
    23,
    24
  ],
  "visited": [],
  "result": 0,
  "output": []
}
Step 17: Complete: 4 bounded Voronoi cells.
State at this checkpoint
{
  "values": [
    0,
    1,
    2,
    3,
    4,
    5,
    6,
    7,
    8,
    9,
    10,
    11,
    12,
    13,
    14,
    15,
    16,
    17,
    18,
    19,
    20,
    21,
    22,
    23,
    24,
    25,
    26
  ],
  "active": [],
  "kind": "graph",
  "points": [
    [
      -10,
      -10
    ],
    [
      10,
      -10
    ],
    [
      10,
      10
    ],
    [
      -10,
      10
    ],
    [
      -4,
      -3
    ],
    [
      4,
      -3
    ],
    [
      0,
      4
    ],
    [
      0,
      0
    ],
    [
      -10,
      -10
    ],
    [
      0,
      -10
    ],
    [
      0,
      -4.166666666666667
    ],
    [
      -4.625,
      2
    ],
    [
      -10,
      5.071428571428571
    ],
    [
      0,
      -10
    ],
    [
      10,
      -10
    ],
    [
      10,
      5.071428571428571
    ],
    [
      4.625,
      2.0000000000000004
    ],
    [
      0,
      -4.166666666666666
    ],
    [
      -10,
      5.071428571428571
    ],
    [
      -4.625,
      2
    ],
    [
      4.625000000000001,
      2
    ],
    [
      10,
      5.071428571428571
    ],
    [
      10,
      10
    ],
    [
      -10,
      10
    ],
    [
      -4.625,
      2
    ],
    [
      0,
      -4.166666666666666
    ],
    [
      4.624999999999999,
      2
    ]
  ],
  "nodeLabels": [
    "",
    "",
    "",
    "",
    "S0 (-4, -3)",
    "S1 (4, -3)",
    "S2 (0, 4)",
    "S3 (0, 0)",
    "",
    "",
    "",
    "",
    "",
    "",
    "",
    "",
    "",
    "",
    "",
    "",
    "",
    "",
    "",
    "",
    "",
    "",
    ""
  ],
  "pointMarkerIndices": [
    4,
    5,
    6,
    7
  ],
  "pointLabelIndices": [
    4,
    5,
    6,
    7
  ],
  "polygons": [
    {
      "indices": [
        8,
        9,
        10,
        11,
        12
      ],
      "color": [
        0.18,
        0.48,
        0.6
      ]
    },
    {
      "indices": [
        13,
        14,
        15,
        16,
        17
      ],
      "color": [
        0.42,
        0.3,
        0.6
      ]
    },
    {
      "indices": [
        18,
        19,
        20,
        21,
        22,
        23
      ],
      "color": [
        0.2,
        0.52,
        0.35
      ]
    },
    {
      "indices": [
        24,
        25,
        26
      ],
      "color": [
        0.6,
        0.4,
        0.18
      ]
    }
  ],
  "directed": false,
  "chosen": [],
  "visited": [],
  "result": 4,
  "output": [
    47,
    0,
    5,
    -10,
    -10,
    0,
    -10,
    0,
    -4.166666666666667,
    -4.625,
    2,
    -10,
    5.071428571428571,
    1,
    5,
    0,
    -10,
    10,
    -10,
    10,
    5.071428571428571,
    4.625,
    2.0000000000000004,
    0,
    -4.166666666666666,
    2,
    6,
    -10,
    5.071428571428571,
    -4.625,
    2,
    4.625000000000001,
    2,
    10,
    5.071428571428571,
    10,
    10,
    -10,
    10,
    3,
    3,
    -4.625,
    2,
    0,
    -4.166666666666666,
    4.624999999999999,
    2
  ]
}
Expected final state
Complete: 4 bounded Voronoi cells.
Complexity and input bounds
Family: Geometry. Time complexity: O(n^3) bounded cell clipping.
Implementation detail: Up to eight integer sites -8..8; cells are clipped to [-10,10]^2. Return unique-site count and encode output[0]=total used doubles, followed by [originalSiteIndex,vertexCount,x0,y0,...] per cell in first-input-index order. Cell boundaries are CCW from the lexicographic minimum. Capacity 256 doubles suffices. Empty input writes [1]; invalid input returns -1 without writes. Half-plane threshold 1e-9 and canonicalization threshold 1e-8 are stated. The independent oracle intersects pairs of cell constraints, tests feasibility and forms their hull.
Space complexity: O(n) working vertices per cell plus encoded output and saved frames.
Working-space bounds describe algorithm state and any explicitly noted output, excluding the visualization's saved timeline. Recording frames can use more memory than running the function alone. Here n is sequence length, V and E are vertex and edge counts, and other parameters refer to the named input dimensions.
1..8 integer sites x,y separated by ;, coordinates -8..8. Cells are clipped to [-10,10]^2. Coincident sites use the first original index; cells and vertices use deterministic order.
The playground validates these limits before starting. Downloaded functions are callable implementations, with parameter and output-buffer contracts in their comments; they do not all repeat the playground's input validation.
Common mistakes and limitations
Deduplicate coincident sites deterministically. Keep the correct side of each bisector and use squared-distance algebra to avoid unnecessary square roots. Distinguish bounding-box edges from intrinsic unbounded Voronoi rays.
Further reading
For background on algorithm analysis and the JavaScript function interface:
- MIT OpenCourseWare: algorithm design and analysis foundations
- MDN: JavaScript function parameters and return values
Editorial and testing approach · Browse all algorithm guides
Complete JavaScript implementation
1 2 3 4 5 6 7 8 9 10 11 12 13 14 | // Bounded Euclidean Voronoi cells for n 0..8 integer sites -8..8, clipped to fixed box [-10,10]^2. Coincident sites use first original index; cells follow that input order. Return unique-cell count; write output[0]=total used doubles, then per cell [originalSiteIndex,vertexCount,x0,y0,...]. Output capacity 256 doubles suffices. Each cell is CCW from lexicographic minimum. Empty writes [1] and returns 0. Invalid inputs return -1 without writes. Bisector half-plane threshold 1e-9, duplicate/collinearity canonicalization 1e-8; floating coordinates are tolerance-based. Inputs unchanged. Naive O(n^3) bounded cell construction and O(n) scratch per cell. Reference snippets assume validated playground inputs. Fixed scratch buffers have 256 slots. Sorting variants may use a different traversal strategy than the animation. function algorithm(x, y, n, output) { if (n < 0 || n > 8) { return -1; } for (let i = 0; i < n; i++) { if (x[i] < -8 || x[i] > 8 || y[i] < -8 || y[i] > 8) { return -1; } } let workX = Array(256).fill(0); let workY = Array(256).fill(0); let tempX = Array(256).fill(0); let tempY = Array(256).fill(0); let count = 0; let nextCount = 0; let previousInside = 0; let currentInside = 0; let previousX = 0.0; let previousY = 0.0; let currentX = 0.0; let currentY = 0.0; let previousDistance = 0.0; let currentDistance = 0.0; let ratio = 0.0; let unique = Array(256).fill(0); let size = 0; let duplicate = 0; let id = 0; let other = 0; let offset = 1; let planeA = 0.0; let planeB = 0.0; let planeC = 0.0; for (let i = 0; i < n; i++) { duplicate = 0; for (let j = 0; j < size; j++) { if (x[i] == x[unique[j]] && y[i] == y[unique[j]]) { duplicate = 1; } } if (duplicate == 0) { unique[size] = i; size++; } } for (let site = 0; site < size; site++) { id = unique[site]; count = 4; workX[0] = -10.0; workY[0] = -10.0; workX[1] = 10.0; workY[1] = -10.0; workX[2] = 10.0; workY[2] = 10.0; workX[3] = -10.0; workY[3] = 10.0; for (let rival = 0; rival < size; rival++) { if (rival == site) { continue; } other = unique[rival]; planeA = 2*(x[other]-x[id]); planeB = 2*(y[other]-y[id]); planeC = x[other]*x[other]+y[other]*y[other]-x[id]*x[id]-y[id]*y[id]; if (count > 0) { nextCount = 0; previousX = workX[count-1]; previousY = workY[count-1]; previousDistance = planeC-planeA*previousX-planeB*previousY; previousInside = 0; if (previousDistance >= -1e-9) { previousInside = 1; } for (let point = 0; point < count; point++) { currentX = workX[point]; currentY = workY[point]; currentDistance = planeC-planeA*currentX-planeB*currentY; currentInside = 0; if (currentDistance >= -1e-9) { currentInside = 1; } if (previousInside != currentInside) { ratio = previousDistance/(previousDistance-currentDistance); tempX[nextCount] = previousX+ratio*(currentX-previousX); tempY[nextCount] = previousY+ratio*(currentY-previousY); nextCount++; } if (currentInside != 0) { tempX[nextCount] = currentX; tempY[nextCount] = currentY; nextCount++; } previousX = currentX; previousY = currentY; previousDistance = currentDistance; previousInside = currentInside; } count = nextCount; for (let point = 0; point < count; point++) { workX[point] = tempX[point]; workY[point] = tempY[point]; } } } let packed = 0; let changed = 0; let prior = 0; let nextIndex = 0; let best = 0; let last = 0; let cursor = 0; let area = 0.0; let turn = 0.0; let keyX = 0.0; let keyY = 0.0; for (let i = 0; i < count; i++) { if (packed == 0 || Math.abs(workX[i]-workX[packed-1])+Math.abs(workY[i]-workY[packed-1]) > 1e-8) { workX[packed] = workX[i]; workY[packed] = workY[i]; packed++; } } count = packed; if (count > 1 && Math.abs(workX[0]-workX[count-1])+Math.abs(workY[0]-workY[count-1]) <= 1e-8) { count--; } if (count > 1) { for (let i = 0; i < count; i++) { nextIndex = (i+1)%count; area += workX[i]*workY[nextIndex]-workY[i]*workX[nextIndex]; } if (Math.abs(area) <= 1e-8) { best = 0; last = 0; for (let i = 1; i < count; i++) { if (workX[i] < workX[best]-1e-8 || (Math.abs(workX[i]-workX[best]) <= 1e-8 && workY[i] < workY[best])) { best = i; } if (workX[i] > workX[last]+1e-8 || (Math.abs(workX[i]-workX[last]) <= 1e-8 && workY[i] > workY[last])) { last = i; } } keyX = workX[last]; keyY = workY[last]; workX[0] = workX[best]; workY[0] = workY[best]; count = 1; if (Math.abs(keyX-workX[0])+Math.abs(keyY-workY[0]) > 1e-8) { workX[1] = keyX; workY[1] = keyY; count = 2; } } else { changed = 1; while (changed != 0 && count > 2) { changed = 0; for (let i = 0; i < count && changed == 0; i++) { prior = (i+count-1)%count; nextIndex = (i+1)%count; turn = (workX[i]-workX[prior])*(workY[nextIndex]-workY[prior])-(workY[i]-workY[prior])*(workX[nextIndex]-workX[prior]); if (Math.abs(turn) <= 1e-8) { for (let j = i; j < count-1; j++) { workX[j] = workX[j+1]; workY[j] = workY[j+1]; } count--; changed = 1; } } } if (area < 0.0) { for (let i = 0; i < count/2; i++) { cursor = count-1-i; keyX = workX[i]; keyY = workY[i]; workX[i] = workX[cursor]; workY[i] = workY[cursor]; workX[cursor] = keyX; workY[cursor] = keyY; } } } } if (count > 0) { best = 0; for (let i = 1; i < count; i++) { if (workX[i] < workX[best]-1e-8 || (Math.abs(workX[i]-workX[best]) <= 1e-8 && workY[i] < workY[best])) { best = i; } } for (let i = 0; i < count; i++) { tempX[i] = workX[(best+i)%count]; tempY[i] = workY[(best+i)%count]; } for (let i = 0; i < count; i++) { workX[i] = tempX[i]; workY[i] = tempY[i]; } } output[offset] = id; output[offset+1] = count; offset += 2; for (let i = 0; i < count; i++) { output[offset] = workX[i]; output[offset+1] = workY[i]; offset += 2; } } output[0] = offset; return size; } |
Source
The textbook supplies the modern planar nearest-site reference. Voronoi?s historical quadratic-form/parallelotope research is included for provenance, not as the exact bounded half-plane-clipping algorithm used here. The playground constructs cells independently inside a fixed box rather than using Fortune?s sweep.
- Computational Geometry
Mark de Berg; Otfried Cheong; Marc van Kreveld; Mark Overmars (2008). Reference book. - Nouvelles applications des paramètres continus à la théorie des formes quadratiques. Deuxième mémoire. Recherches sur les parallélloèdres primitifs.
Georges Voronoi (1908). Historical research paper.