Published by Dimitris Kougioumtzis · Updated
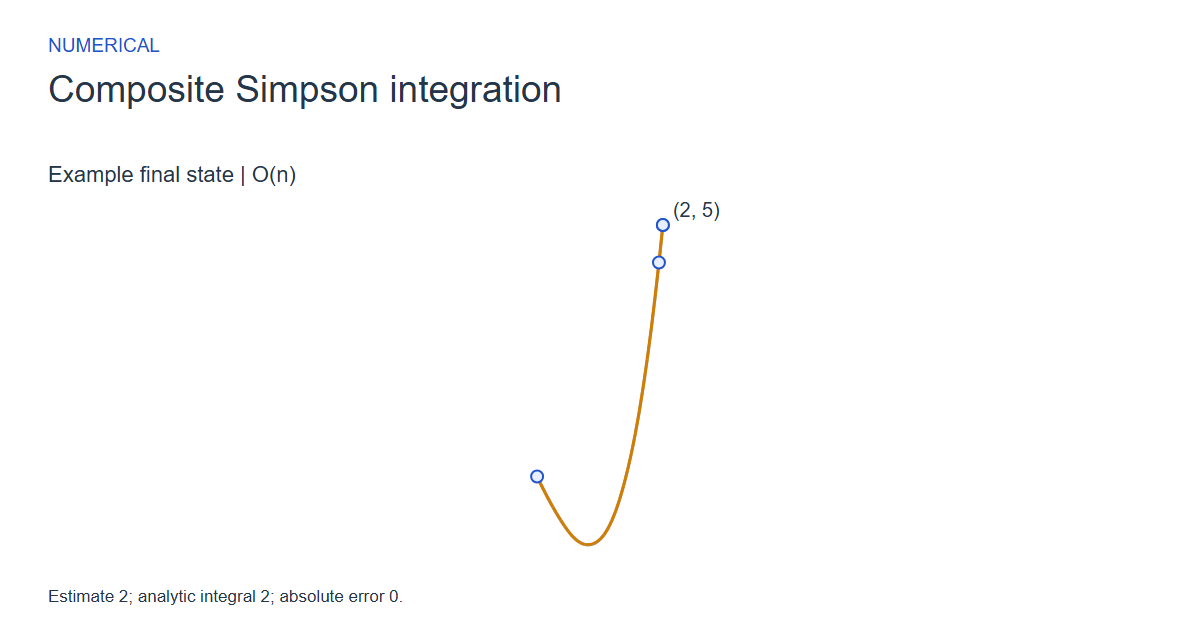
Integrate f(x)=x^3-2x+1 with a bounded composite rule and compare with its analytic integral.
Sample f(x)=x^3-2x+1 on equally spaced nodes and combine their values with endpoint, alternating four and two weights for quadratic panels spanning pairs of intervals.
When to use Composite Simpson integration
Teaching composite numerical integration and checking an approximation against an independently known analytic integral.
Choosing an alternative
The trapezoidal rule integrates piecewise linear interpolants. Simpson integrates piecewise quadratic interpolants and is exact for this cubic up to floating-point roundoff. This exactness does not extend to arbitrary functions.
Worked example: input and state changes
Example input
0,2,8These checkpoints follow the actual example timeline. State details show the stored values and decisions; use the visualization to inspect every intervening step.
Step 0: Integrand f(x)=x^3-2x+1; analytic integral 2.
State at this checkpoint
{
  "values": [
    0,
    1,
    2,
    3,
    4,
    5,
    6,
    7,
    8,
    9,
    10,
    11,
    12,
    13,
    14,
    15,
    16,
    17,
    18,
    19,
    20,
    21,
    22,
    23,
    24,
    25,
    26,
    27,
    28,
    29,
    30,
    31,
    32,
    33,
    34,
    35,
    36,
    37,
    38,
    39,
    40
  ],
  "active": [],
  "kind": "graph",
  "points": [
    [
      0,
      1
    ],
    [
      0.05,
      0.900125
    ],
    [
      0.1,
      0.8009999999999999
    ],
    [
      0.15,
      0.7033750000000001
    ],
    [
      0.2,
      0.608
    ],
    [
      0.25,
      0.515625
    ],
    [
      0.3,
      0.42700000000000005
    ],
    [
      0.35,
      0.34287500000000004
    ],
    [
      0.4,
      0.264
    ],
    [
      0.45,
      0.191125
    ],
    [
      0.5,
      0.125
    ],
    [
      0.55,
      0.06637499999999996
    ],
    [
      0.6,
      0.016000000000000014
    ],
    [
      0.65,
      -0.025374999999999925
    ],
    [
      0.7,
      -0.05699999999999994
    ],
    [
      0.75,
      -0.078125
    ],
    [
      0.8,
      -0.08800000000000008
    ],
    [
      0.85,
      -0.08587500000000015
    ],
    [
      0.9,
      -0.07099999999999995
    ],
    [
      0.95,
      -0.042625000000000135
    ],
    [
      1,
      0
    ],
    [
      1.05,
      0.05762500000000004
    ],
    [
      1.1,
      0.13100000000000023
    ],
    [
      1.15,
      0.2208749999999997
    ],
    [
      1.2,
      0.32800000000000007
    ],
    [
      1.25,
      0.453125
    ],
    [
      1.3,
      0.5970000000000004
    ],
    [
      1.35,
      0.7603750000000002
    ],
    [
      1.4,
      0.9439999999999995
    ],
    [
      1.45,
      1.148625
    ],
    [
      1.5,
      1.375
    ],
    [
      1.55,
      1.6238750000000004
    ],
    [
      1.6,
      1.8960000000000008
    ],
    [
      1.65,
      2.192125
    ],
    [
      1.7,
      2.5129999999999995
    ],
    [
      1.75,
      2.859375
    ],
    [
      1.8,
      3.2320000000000007
    ],
    [
      1.85,
      3.6316250000000005
    ],
    [
      1.9,
      4.058999999999999
    ],
    [
      1.95,
      4.514875
    ],
    [
      2,
      5
    ]
  ],
  "nodeLabels": [
    "(0, 1)",
    "",
    "",
    "",
    "",
    "",
    "",
    "",
    "",
    "",
    "",
    "",
    "",
    "",
    "",
    "",
    "",
    "",
    "",
    "",
    "",
    "",
    "",
    "",
    "",
    "",
    "",
    "",
    "",
    "",
    "",
    "",
    "",
    "",
    "",
    "",
    "",
    "",
    "",
    "",
    "(2, 5)"
  ],
  "pointLabelIndices": [
    0,
    40
  ],
  "pointMarkerIndices": [
    0,
    40
  ],
  "directed": false,
  "chosen": [],
  "visited": [],
  "result": 0,
  "output": [
    0,
    0,
    0
  ]
}
Step 3: Node 2: rule weight 2, weighted sum 3.3125. Gold shows completed quadratic panels.
State at this checkpoint
{
  "values": [
    0,
    1,
    2,
    3,
    4,
    5,
    6,
    7,
    8,
    9,
    10,
    11,
    12,
    13,
    14,
    15,
    16,
    17,
    18,
    19,
    20,
    21,
    22,
    23,
    24,
    25,
    26,
    27,
    28,
    29,
    30,
    31,
    32,
    33,
    34,
    35,
    36,
    37,
    38,
    39,
    40,
    41,
    42,
    43,
    44,
    45,
    46,
    47,
    48,
    49,
    50,
    51
  ],
  "active": [
    41,
    42,
    43,
    44,
    45,
    46,
    47,
    48,
    49,
    50,
    51
  ],
  "kind": "graph",
  "points": [
    [
      0,
      1
    ],
    [
      0.05,
      0.900125
    ],
    [
      0.1,
      0.8009999999999999
    ],
    [
      0.15,
      0.7033750000000001
    ],
    [
      0.2,
      0.608
    ],
    [
      0.25,
      0.515625
    ],
    [
      0.3,
      0.42700000000000005
    ],
    [
      0.35,
      0.34287500000000004
    ],
    [
      0.4,
      0.264
    ],
    [
      0.45,
      0.191125
    ],
    [
      0.5,
      0.125
    ],
    [
      0.55,
      0.06637499999999996
    ],
    [
      0.6,
      0.016000000000000014
    ],
    [
      0.65,
      -0.025374999999999925
    ],
    [
      0.7,
      -0.05699999999999994
    ],
    [
      0.75,
      -0.078125
    ],
    [
      0.8,
      -0.08800000000000008
    ],
    [
      0.85,
      -0.08587500000000015
    ],
    [
      0.9,
      -0.07099999999999995
    ],
    [
      0.95,
      -0.042625000000000135
    ],
    [
      1,
      0
    ],
    [
      1.05,
      0.05762500000000004
    ],
    [
      1.1,
      0.13100000000000023
    ],
    [
      1.15,
      0.2208749999999997
    ],
    [
      1.2,
      0.32800000000000007
    ],
    [
      1.25,
      0.453125
    ],
    [
      1.3,
      0.5970000000000004
    ],
    [
      1.35,
      0.7603750000000002
    ],
    [
      1.4,
      0.9439999999999995
    ],
    [
      1.45,
      1.148625
    ],
    [
      1.5,
      1.375
    ],
    [
      1.55,
      1.6238750000000004
    ],
    [
      1.6,
      1.8960000000000008
    ],
    [
      1.65,
      2.192125
    ],
    [
      1.7,
      2.5129999999999995
    ],
    [
      1.75,
      2.859375
    ],
    [
      1.8,
      3.2320000000000007
    ],
    [
      1.85,
      3.6316250000000005
    ],
    [
      1.9,
      4.058999999999999
    ],
    [
      1.95,
      4.514875
    ],
    [
      2,
      5
    ],
    [
      0,
      1
    ],
    [
      0.0625,
      0.8701171875
    ],
    [
      0.125,
      0.74609375
    ],
    [
      0.1875,
      0.6279296875
    ],
    [
      0.25,
      0.515625
    ],
    [
      0.3125,
      0.4091796875
    ],
    [
      0.375,
      0.30859375
    ],
    [
      0.4375,
      0.2138671875
    ],
    [
      0.5,
      0.125
    ],
    [
      0.5,
      0
    ],
    [
      0.5,
      0.125
    ]
  ],
  "nodeLabels": [
    "(0, 1)",
    "",
    "",
    "",
    "",
    "",
    "",
    "",
    "",
    "",
    "",
    "",
    "",
    "",
    "",
    "",
    "",
    "",
    "",
    "",
    "",
    "",
    "",
    "",
    "",
    "",
    "",
    "",
    "",
    "",
    "",
    "",
    "",
    "",
    "",
    "",
    "",
    "",
    "",
    "",
    "(2, 5)",
    "(0, 1)",
    "(0.0625, 0.870117)",
    "(0.125, 0.746094)",
    "(0.1875, 0.62793)",
    "(0.25, 0.515625)",
    "(0.3125, 0.40918)",
    "(0.375, 0.308594)",
    "(0.4375, 0.213867)",
    "(0.5, 0.125)",
    "(0.5, 0)",
    "(0.5, 0.125)"
  ],
  "pointLabelIndices": [
    51
  ],
  "pointMarkerIndices": [
    0,
    40,
    50,
    51
  ],
  "directed": false,
  "chosen": [
    40,
    41,
    42,
    43,
    44,
    45,
    46,
    47,
    48
  ],
  "visited": [],
  "result": 0,
  "output": [
    0,
    0,
    0
  ]
}
Step 5: Node 4: rule weight 2, weighted sum 3. Gold shows completed quadratic panels.
State at this checkpoint
{
  "values": [
    0,
    1,
    2,
    3,
    4,
    5,
    6,
    7,
    8,
    9,
    10,
    11,
    12,
    13,
    14,
    15,
    16,
    17,
    18,
    19,
    20,
    21,
    22,
    23,
    24,
    25,
    26,
    27,
    28,
    29,
    30,
    31,
    32,
    33,
    34,
    35,
    36,
    37,
    38,
    39,
    40,
    41,
    42,
    43,
    44,
    45,
    46,
    47,
    48,
    49,
    50,
    51,
    52,
    53,
    54,
    55,
    56,
    57,
    58,
    59,
    60
  ],
  "active": [
    41,
    42,
    43,
    44,
    45,
    46,
    47,
    48,
    49,
    50,
    51,
    52,
    53,
    54,
    55,
    56,
    57,
    58,
    59,
    60
  ],
  "kind": "graph",
  "points": [
    [
      0,
      1
    ],
    [
      0.05,
      0.900125
    ],
    [
      0.1,
      0.8009999999999999
    ],
    [
      0.15,
      0.7033750000000001
    ],
    [
      0.2,
      0.608
    ],
    [
      0.25,
      0.515625
    ],
    [
      0.3,
      0.42700000000000005
    ],
    [
      0.35,
      0.34287500000000004
    ],
    [
      0.4,
      0.264
    ],
    [
      0.45,
      0.191125
    ],
    [
      0.5,
      0.125
    ],
    [
      0.55,
      0.06637499999999996
    ],
    [
      0.6,
      0.016000000000000014
    ],
    [
      0.65,
      -0.025374999999999925
    ],
    [
      0.7,
      -0.05699999999999994
    ],
    [
      0.75,
      -0.078125
    ],
    [
      0.8,
      -0.08800000000000008
    ],
    [
      0.85,
      -0.08587500000000015
    ],
    [
      0.9,
      -0.07099999999999995
    ],
    [
      0.95,
      -0.042625000000000135
    ],
    [
      1,
      0
    ],
    [
      1.05,
      0.05762500000000004
    ],
    [
      1.1,
      0.13100000000000023
    ],
    [
      1.15,
      0.2208749999999997
    ],
    [
      1.2,
      0.32800000000000007
    ],
    [
      1.25,
      0.453125
    ],
    [
      1.3,
      0.5970000000000004
    ],
    [
      1.35,
      0.7603750000000002
    ],
    [
      1.4,
      0.9439999999999995
    ],
    [
      1.45,
      1.148625
    ],
    [
      1.5,
      1.375
    ],
    [
      1.55,
      1.6238750000000004
    ],
    [
      1.6,
      1.8960000000000008
    ],
    [
      1.65,
      2.192125
    ],
    [
      1.7,
      2.5129999999999995
    ],
    [
      1.75,
      2.859375
    ],
    [
      1.8,
      3.2320000000000007
    ],
    [
      1.85,
      3.6316250000000005
    ],
    [
      1.9,
      4.058999999999999
    ],
    [
      1.95,
      4.514875
    ],
    [
      2,
      5
    ],
    [
      0,
      1
    ],
    [
      0.0625,
      0.8701171875
    ],
    [
      0.125,
      0.74609375
    ],
    [
      0.1875,
      0.6279296875
    ],
    [
      0.25,
      0.515625
    ],
    [
      0.3125,
      0.4091796875
    ],
    [
      0.375,
      0.30859375
    ],
    [
      0.4375,
      0.2138671875
    ],
    [
      0.5,
      0.125
    ],
    [
      0.5,
      0.125
    ],
    [
      0.5625,
      0.0478515625
    ],
    [
      0.625,
      -0.01171875
    ],
    [
      0.6875,
      -0.0537109375
    ],
    [
      0.75,
      -0.078125
    ],
    [
      0.8125,
      -0.0849609375
    ],
    [
      0.875,
      -0.07421875
    ],
    [
      0.9375,
      -0.0458984375
    ],
    [
      1,
      0
    ],
    [
      1,
      0
    ],
    [
      1,
      0
    ]
  ],
  "nodeLabels": [
    "(0, 1)",
    "",
    "",
    "",
    "",
    "",
    "",
    "",
    "",
    "",
    "",
    "",
    "",
    "",
    "",
    "",
    "",
    "",
    "",
    "",
    "",
    "",
    "",
    "",
    "",
    "",
    "",
    "",
    "",
    "",
    "",
    "",
    "",
    "",
    "",
    "",
    "",
    "",
    "",
    "",
    "(2, 5)",
    "(0, 1)",
    "(0.0625, 0.870117)",
    "(0.125, 0.746094)",
    "(0.1875, 0.62793)",
    "(0.25, 0.515625)",
    "(0.3125, 0.40918)",
    "(0.375, 0.308594)",
    "(0.4375, 0.213867)",
    "(0.5, 0.125)",
    "(0.5, 0.125)",
    "(0.5625, 0.0478516)",
    "(0.625, -0.0117188)",
    "(0.6875, -0.0537109)",
    "(0.75, -0.078125)",
    "(0.8125, -0.0849609)",
    "(0.875, -0.0742188)",
    "(0.9375, -0.0458984)",
    "(1, 0)",
    "(1, 0)",
    "(1, 0)"
  ],
  "pointLabelIndices": [
    60
  ],
  "pointMarkerIndices": [
    0,
    40,
    59,
    60
  ],
  "directed": false,
  "chosen": [
    40,
    41,
    42,
    43,
    44,
    45,
    46,
    47,
    48,
    49,
    50,
    51,
    52,
    53,
    54,
    55,
    56,
    57
  ],
  "visited": [],
  "result": 0,
  "output": [
    0,
    0,
    0
  ]
}
Step 8: Node 7: rule weight 4, weighted sum 19. Gold shows completed quadratic panels.
State at this checkpoint
{
  "values": [
    0,
    1,
    2,
    3,
    4,
    5,
    6,
    7,
    8,
    9,
    10,
    11,
    12,
    13,
    14,
    15,
    16,
    17,
    18,
    19,
    20,
    21,
    22,
    23,
    24,
    25,
    26,
    27,
    28,
    29,
    30,
    31,
    32,
    33,
    34,
    35,
    36,
    37,
    38,
    39,
    40,
    41,
    42,
    43,
    44,
    45,
    46,
    47,
    48,
    49,
    50,
    51,
    52,
    53,
    54,
    55,
    56,
    57,
    58,
    59,
    60,
    61,
    62,
    63,
    64,
    65,
    66,
    67,
    68,
    69
  ],
  "active": [
    41,
    42,
    43,
    44,
    45,
    46,
    47,
    48,
    49,
    50,
    51,
    52,
    53,
    54,
    55,
    56,
    57,
    58,
    59,
    60,
    61,
    62,
    63,
    64,
    65,
    66,
    67,
    68,
    69
  ],
  "kind": "graph",
  "points": [
    [
      0,
      1
    ],
    [
      0.05,
      0.900125
    ],
    [
      0.1,
      0.8009999999999999
    ],
    [
      0.15,
      0.7033750000000001
    ],
    [
      0.2,
      0.608
    ],
    [
      0.25,
      0.515625
    ],
    [
      0.3,
      0.42700000000000005
    ],
    [
      0.35,
      0.34287500000000004
    ],
    [
      0.4,
      0.264
    ],
    [
      0.45,
      0.191125
    ],
    [
      0.5,
      0.125
    ],
    [
      0.55,
      0.06637499999999996
    ],
    [
      0.6,
      0.016000000000000014
    ],
    [
      0.65,
      -0.025374999999999925
    ],
    [
      0.7,
      -0.05699999999999994
    ],
    [
      0.75,
      -0.078125
    ],
    [
      0.8,
      -0.08800000000000008
    ],
    [
      0.85,
      -0.08587500000000015
    ],
    [
      0.9,
      -0.07099999999999995
    ],
    [
      0.95,
      -0.042625000000000135
    ],
    [
      1,
      0
    ],
    [
      1.05,
      0.05762500000000004
    ],
    [
      1.1,
      0.13100000000000023
    ],
    [
      1.15,
      0.2208749999999997
    ],
    [
      1.2,
      0.32800000000000007
    ],
    [
      1.25,
      0.453125
    ],
    [
      1.3,
      0.5970000000000004
    ],
    [
      1.35,
      0.7603750000000002
    ],
    [
      1.4,
      0.9439999999999995
    ],
    [
      1.45,
      1.148625
    ],
    [
      1.5,
      1.375
    ],
    [
      1.55,
      1.6238750000000004
    ],
    [
      1.6,
      1.8960000000000008
    ],
    [
      1.65,
      2.192125
    ],
    [
      1.7,
      2.5129999999999995
    ],
    [
      1.75,
      2.859375
    ],
    [
      1.8,
      3.2320000000000007
    ],
    [
      1.85,
      3.6316250000000005
    ],
    [
      1.9,
      4.058999999999999
    ],
    [
      1.95,
      4.514875
    ],
    [
      2,
      5
    ],
    [
      0,
      1
    ],
    [
      0.0625,
      0.8701171875
    ],
    [
      0.125,
      0.74609375
    ],
    [
      0.1875,
      0.6279296875
    ],
    [
      0.25,
      0.515625
    ],
    [
      0.3125,
      0.4091796875
    ],
    [
      0.375,
      0.30859375
    ],
    [
      0.4375,
      0.2138671875
    ],
    [
      0.5,
      0.125
    ],
    [
      0.5,
      0.125
    ],
    [
      0.5625,
      0.0478515625
    ],
    [
      0.625,
      -0.01171875
    ],
    [
      0.6875,
      -0.0537109375
    ],
    [
      0.75,
      -0.078125
    ],
    [
      0.8125,
      -0.0849609375
    ],
    [
      0.875,
      -0.07421875
    ],
    [
      0.9375,
      -0.0458984375
    ],
    [
      1,
      0
    ],
    [
      1,
      0
    ],
    [
      1.0625,
      0.0693359375
    ],
    [
      1.125,
      0.16796875
    ],
    [
      1.1875,
      0.2958984375
    ],
    [
      1.25,
      0.453125
    ],
    [
      1.3125,
      0.6396484375
    ],
    [
      1.375,
      0.85546875
    ],
    [
      1.4375,
      1.1005859375
    ],
    [
      1.5,
      1.375
    ],
    [
      1.75,
      0
    ],
    [
      1.75,
      2.859375
    ]
  ],
  "nodeLabels": [
    "(0, 1)",
    "",
    "",
    "",
    "",
    "",
    "",
    "",
    "",
    "",
    "",
    "",
    "",
    "",
    "",
    "",
    "",
    "",
    "",
    "",
    "",
    "",
    "",
    "",
    "",
    "",
    "",
    "",
    "",
    "",
    "",
    "",
    "",
    "",
    "",
    "",
    "",
    "",
    "",
    "",
    "(2, 5)",
    "(0, 1)",
    "(0.0625, 0.870117)",
    "(0.125, 0.746094)",
    "(0.1875, 0.62793)",
    "(0.25, 0.515625)",
    "(0.3125, 0.40918)",
    "(0.375, 0.308594)",
    "(0.4375, 0.213867)",
    "(0.5, 0.125)",
    "(0.5, 0.125)",
    "(0.5625, 0.0478516)",
    "(0.625, -0.0117188)",
    "(0.6875, -0.0537109)",
    "(0.75, -0.078125)",
    "(0.8125, -0.0849609)",
    "(0.875, -0.0742188)",
    "(0.9375, -0.0458984)",
    "(1, 0)",
    "(1, 0)",
    "(1.0625, 0.0693359)",
    "(1.125, 0.167969)",
    "(1.1875, 0.295898)",
    "(1.25, 0.453125)",
    "(1.3125, 0.639648)",
    "(1.375, 0.855469)",
    "(1.4375, 1.10059)",
    "(1.5, 1.375)",
    "(1.75, 0)",
    "(1.75, 2.85938)"
  ],
  "pointLabelIndices": [
    69
  ],
  "pointMarkerIndices": [
    0,
    40,
    68,
    69
  ],
  "directed": false,
  "chosen": [
    40,
    41,
    42,
    43,
    44,
    45,
    46,
    47,
    48,
    49,
    50,
    51,
    52,
    53,
    54,
    55,
    56,
    57,
    58,
    59,
    60,
    61,
    62,
    63,
    64,
    65,
    66
  ],
  "visited": [],
  "result": 0,
  "output": [
    0,
    0,
    0
  ]
}
Step 10: Estimate 2; analytic integral 2; absolute error 0.
State at this checkpoint
{
  "values": [
    0,
    1,
    2,
    3,
    4,
    5,
    6,
    7,
    8,
    9,
    10,
    11,
    12,
    13,
    14,
    15,
    16,
    17,
    18,
    19,
    20,
    21,
    22,
    23,
    24,
    25,
    26,
    27,
    28,
    29,
    30,
    31,
    32,
    33,
    34,
    35,
    36,
    37,
    38,
    39,
    40,
    41,
    42,
    43,
    44,
    45,
    46,
    47,
    48,
    49,
    50,
    51,
    52,
    53,
    54,
    55,
    56,
    57,
    58,
    59,
    60,
    61,
    62,
    63,
    64,
    65,
    66,
    67,
    68,
    69,
    70,
    71,
    72,
    73,
    74,
    75,
    76
  ],
  "active": [
    41,
    42,
    43,
    44,
    45,
    46,
    47,
    48,
    49,
    50,
    51,
    52,
    53,
    54,
    55,
    56,
    57,
    58,
    59,
    60,
    61,
    62,
    63,
    64,
    65,
    66,
    67,
    68,
    69,
    70,
    71,
    72,
    73,
    74,
    75,
    76
  ],
  "kind": "graph",
  "points": [
    [
      0,
      1
    ],
    [
      0.05,
      0.900125
    ],
    [
      0.1,
      0.8009999999999999
    ],
    [
      0.15,
      0.7033750000000001
    ],
    [
      0.2,
      0.608
    ],
    [
      0.25,
      0.515625
    ],
    [
      0.3,
      0.42700000000000005
    ],
    [
      0.35,
      0.34287500000000004
    ],
    [
      0.4,
      0.264
    ],
    [
      0.45,
      0.191125
    ],
    [
      0.5,
      0.125
    ],
    [
      0.55,
      0.06637499999999996
    ],
    [
      0.6,
      0.016000000000000014
    ],
    [
      0.65,
      -0.025374999999999925
    ],
    [
      0.7,
      -0.05699999999999994
    ],
    [
      0.75,
      -0.078125
    ],
    [
      0.8,
      -0.08800000000000008
    ],
    [
      0.85,
      -0.08587500000000015
    ],
    [
      0.9,
      -0.07099999999999995
    ],
    [
      0.95,
      -0.042625000000000135
    ],
    [
      1,
      0
    ],
    [
      1.05,
      0.05762500000000004
    ],
    [
      1.1,
      0.13100000000000023
    ],
    [
      1.15,
      0.2208749999999997
    ],
    [
      1.2,
      0.32800000000000007
    ],
    [
      1.25,
      0.453125
    ],
    [
      1.3,
      0.5970000000000004
    ],
    [
      1.35,
      0.7603750000000002
    ],
    [
      1.4,
      0.9439999999999995
    ],
    [
      1.45,
      1.148625
    ],
    [
      1.5,
      1.375
    ],
    [
      1.55,
      1.6238750000000004
    ],
    [
      1.6,
      1.8960000000000008
    ],
    [
      1.65,
      2.192125
    ],
    [
      1.7,
      2.5129999999999995
    ],
    [
      1.75,
      2.859375
    ],
    [
      1.8,
      3.2320000000000007
    ],
    [
      1.85,
      3.6316250000000005
    ],
    [
      1.9,
      4.058999999999999
    ],
    [
      1.95,
      4.514875
    ],
    [
      2,
      5
    ],
    [
      0,
      1
    ],
    [
      0.0625,
      0.8701171875
    ],
    [
      0.125,
      0.74609375
    ],
    [
      0.1875,
      0.6279296875
    ],
    [
      0.25,
      0.515625
    ],
    [
      0.3125,
      0.4091796875
    ],
    [
      0.375,
      0.30859375
    ],
    [
      0.4375,
      0.2138671875
    ],
    [
      0.5,
      0.125
    ],
    [
      0.5,
      0.125
    ],
    [
      0.5625,
      0.0478515625
    ],
    [
      0.625,
      -0.01171875
    ],
    [
      0.6875,
      -0.0537109375
    ],
    [
      0.75,
      -0.078125
    ],
    [
      0.8125,
      -0.0849609375
    ],
    [
      0.875,
      -0.07421875
    ],
    [
      0.9375,
      -0.0458984375
    ],
    [
      1,
      0
    ],
    [
      1,
      0
    ],
    [
      1.0625,
      0.0693359375
    ],
    [
      1.125,
      0.16796875
    ],
    [
      1.1875,
      0.2958984375
    ],
    [
      1.25,
      0.453125
    ],
    [
      1.3125,
      0.6396484375
    ],
    [
      1.375,
      0.85546875
    ],
    [
      1.4375,
      1.1005859375
    ],
    [
      1.5,
      1.375
    ],
    [
      1.5,
      1.375
    ],
    [
      1.5625,
      1.6845703125
    ],
    [
      1.625,
      2.03515625
    ],
    [
      1.6875,
      2.4267578125
    ],
    [
      1.75,
      2.859375
    ],
    [
      1.8125,
      3.3330078125
    ],
    [
      1.875,
      3.84765625
    ],
    [
      1.9375,
      4.4033203125
    ],
    [
      2,
      5
    ]
  ],
  "nodeLabels": [
    "(0, 1)",
    "",
    "",
    "",
    "",
    "",
    "",
    "",
    "",
    "",
    "",
    "",
    "",
    "",
    "",
    "",
    "",
    "",
    "",
    "",
    "",
    "",
    "",
    "",
    "",
    "",
    "",
    "",
    "",
    "",
    "",
    "",
    "",
    "",
    "",
    "",
    "",
    "",
    "",
    "",
    "(2, 5)",
    "(0, 1)",
    "(0.0625, 0.870117)",
    "(0.125, 0.746094)",
    "(0.1875, 0.62793)",
    "(0.25, 0.515625)",
    "(0.3125, 0.40918)",
    "(0.375, 0.308594)",
    "(0.4375, 0.213867)",
    "(0.5, 0.125)",
    "(0.5, 0.125)",
    "(0.5625, 0.0478516)",
    "(0.625, -0.0117188)",
    "(0.6875, -0.0537109)",
    "(0.75, -0.078125)",
    "(0.8125, -0.0849609)",
    "(0.875, -0.0742188)",
    "(0.9375, -0.0458984)",
    "(1, 0)",
    "(1, 0)",
    "(1.0625, 0.0693359)",
    "(1.125, 0.167969)",
    "(1.1875, 0.295898)",
    "(1.25, 0.453125)",
    "(1.3125, 0.639648)",
    "(1.375, 0.855469)",
    "(1.4375, 1.10059)",
    "(1.5, 1.375)",
    "(1.5, 1.375)",
    "(1.5625, 1.68457)",
    "(1.625, 2.03516)",
    "(1.6875, 2.42676)",
    "(1.75, 2.85938)",
    "(1.8125, 3.33301)",
    "(1.875, 3.84766)",
    "(1.9375, 4.40332)",
    "(2, 5)"
  ],
  "pointLabelIndices": [
    76
  ],
  "pointMarkerIndices": [
    0,
    40,
    75,
    76
  ],
  "directed": false,
  "chosen": [
    40,
    41,
    42,
    43,
    44,
    45,
    46,
    47,
    48,
    49,
    50,
    51,
    52,
    53,
    54,
    55,
    56,
    57,
    58,
    59,
    60,
    61,
    62,
    63,
    64,
    65,
    66,
    67,
    68,
    69,
    70,
    71,
    72,
    73,
    74
  ],
  "visited": [],
  "result": 1,
  "output": [
    2,
    2,
    0
  ]
}
Expected final state
Estimate 2; analytic integral 2; absolute error 0.
Complexity and input bounds
Family: Numerical. Time complexity: O(n).
Implementation detail: Endpoints are real values -3..3, panels 1..32, with an even count for Simpson. Return 1 and output [estimate,analyticIntegral,absoluteError]; invalid parameters return -1 without writing output. The primitive is x^4/4-x^2+x. Independent tests use the cubic trapezoidal error identity and Simpson polynomial exactness, including reversed and zero-width intervals, in every language. Gold curves show the completed linear or quadratic panel interpolants.
Space complexity: O(1) working quadrature state excluding the sample/plot frames.
Working-space bounds describe algorithm state and any explicitly noted output, excluding the visualization's saved timeline. Recording frames can use more memory than running the function alone. Here n is sequence length, V and E are vertex and edge counts, and other parameters refer to the named input dimensions.
a,b,panels: endpoints -3..3, panels 1..32. Simpson requires an even panel count. Signed and zero-width intervals are supported.
The playground validates these limits before starting. Downloaded functions are callable implementations, with parameter and output-buffer contracts in their comments; they do not all repeat the playground's input validation.
Common mistakes and limitations
Scale by panel width and the correct rule factor. Simpson requires an even panel count. Reversing the interval changes the integral sign; a zero-width interval has zero integral. The displayed analytic error is specific to this example.
Further reading
For background on algorithm analysis and the JavaScript function interface:
- MIT OpenCourseWare: algorithm design and analysis foundations
- MDN: JavaScript function parameters and return values
Editorial and testing approach · Browse all algorithm guides
Complete JavaScript implementation
1 2 3 4 5 6 7 | // Composite Simpson rule for the explicit integrand f(x)=x^3-2x+1. Endpoints -3..3, panels 1..32 and even. Signed/reversed and zero-width intervals supported. Return 1 and write three doubles [estimate,analyticIntegral,absoluteError]; return -1 for invalid parameters without output writes. O(panels) time and O(1) auxiliary state. The analytic comparison is an oracle for this polynomial example, not a general error estimator. Compare floating output with explicit absolute/relative tolerances. Reference snippets assume validated playground inputs. Fixed scratch buffers have 256 slots. Sorting variants may use a different traversal strategy than the animation. function algorithm(a, b, panels, output) { if (Math.abs(a) > 3.0 || Math.abs(b) > 3.0 || panels < 1 || panels > 32 || panels%2 != 0) { return -1; } let h = (b-a)/panels; let sum = 0.0; let x = 0.0; let weight = 0.0; let estimate = 0.0; let exact = (b*b*b*b/4.0-b*b+b)-(a*a*a*a/4.0-a*a+a); for (let i = 0; i <= panels; i++) { x = a+i*h; weight = 2.0; if (i%2 != 0) { weight = 4.0; } if (i == 0 || i == panels) { weight = 1.0; } sum += weight*(x*x*x-2.0*x+1.0); } estimate = h*sum/3.0; output[0] = estimate; output[1] = exact; output[2] = Math.abs(estimate-exact); return 1; } |
Source
NIST?s authored reference gives the composite rule and its assumptions. This is not an asserted original-paper attribution; the playground fixes a cubic integrand so its analytic integral can be independently checked.
- DLMF 3.5: Quadrature
N. M. Temme; NIST Digital Library of Mathematical Functions (2010?present). Authoritative numerical reference.